Loading Lithia
Preparing your development environment...
Preparing your development environment...
Monitor your API in real-time with comprehensive metrics and health indicators.
Uptime and status monitoring
Memory and CPU usage
Response times and throughput
Compilation and hot reload speed
Explore your API structure as a visual tree and create new routes with just a few clicks.
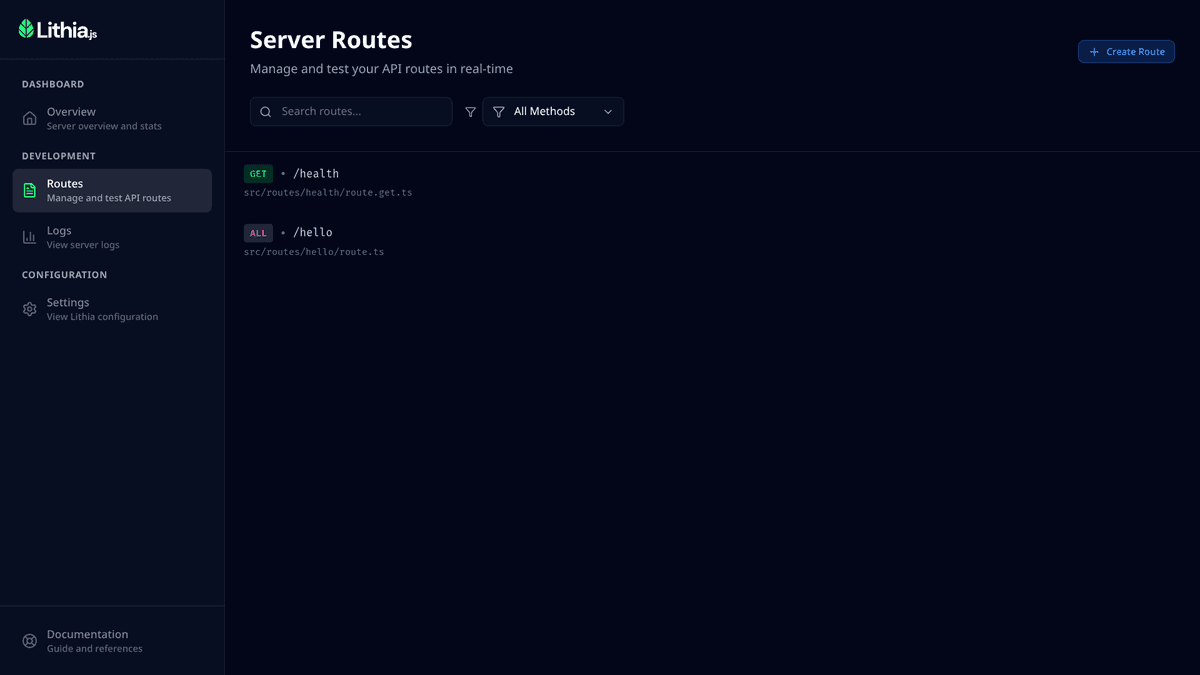
See all your routes organized in a visual tree structure. Navigate through your entire API with ease.
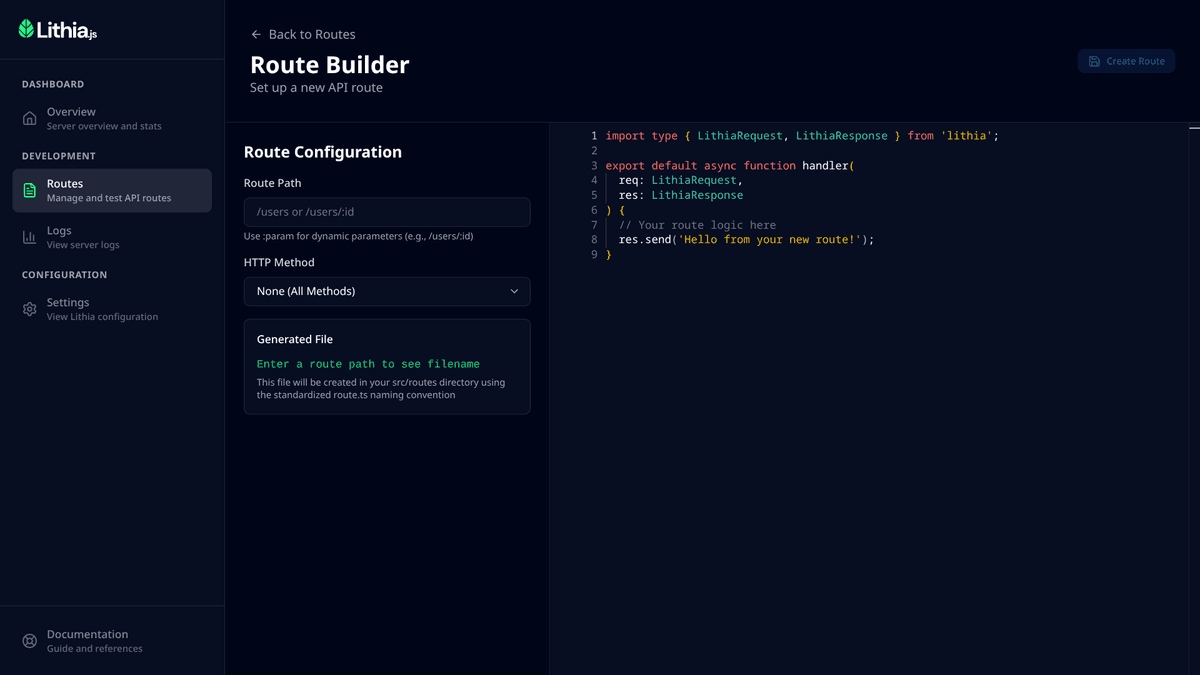
Create new routes with a visual interface. Generate boilerplate code and organize your API structure.
See all routes organized hierarchically
Generate routes with boilerplate code
See all methods at a glance
Navigate to route files instantly
Test your API endpoints without leaving your browser. No need for Postman or cURL anymore.
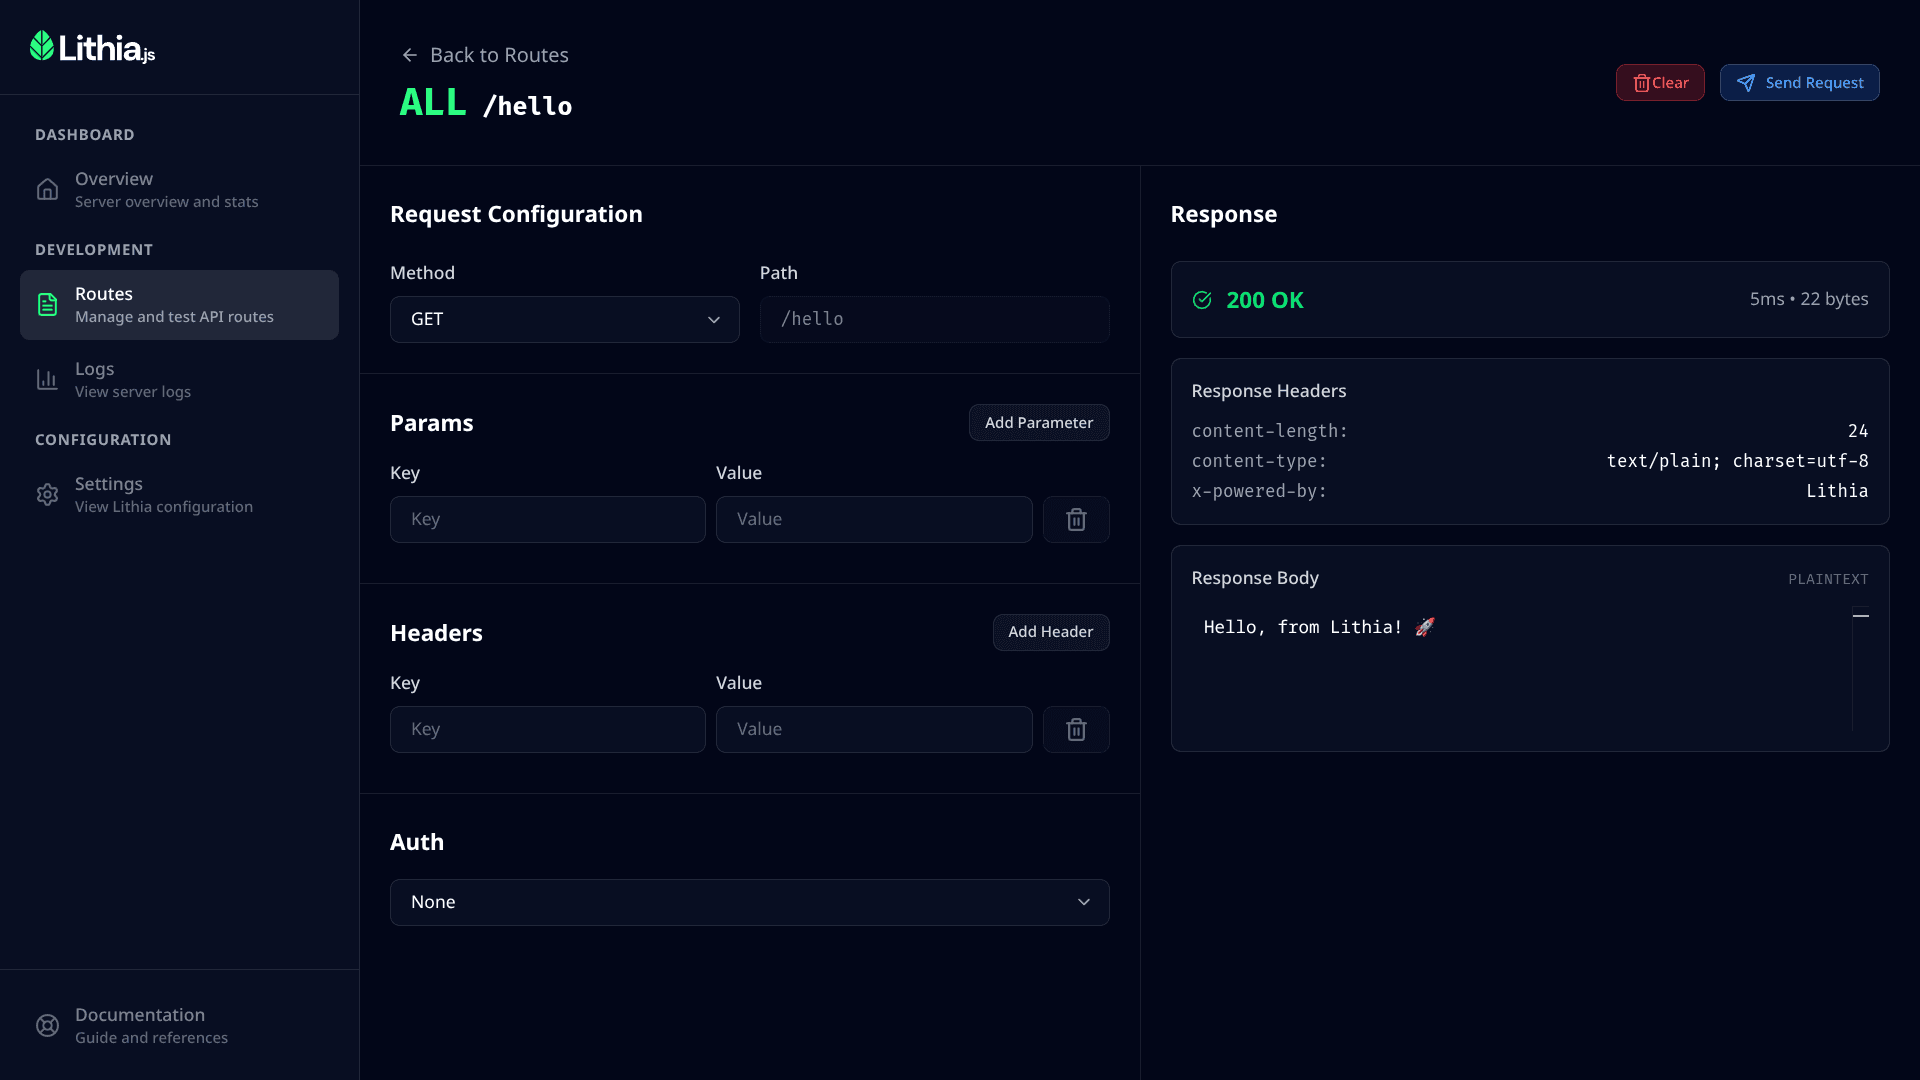
Built-in testing interface allows you to test any endpoint with various HTTP methods, headers, and request body. See formatted responses and easily copy generated code snippets.
No need for Postman or cURL
Headers, params, and body
See responses clearly formatted
Generate code snippets
Stream, filter, and search logs in real-time with syntax highlighting. No more terminal windows.
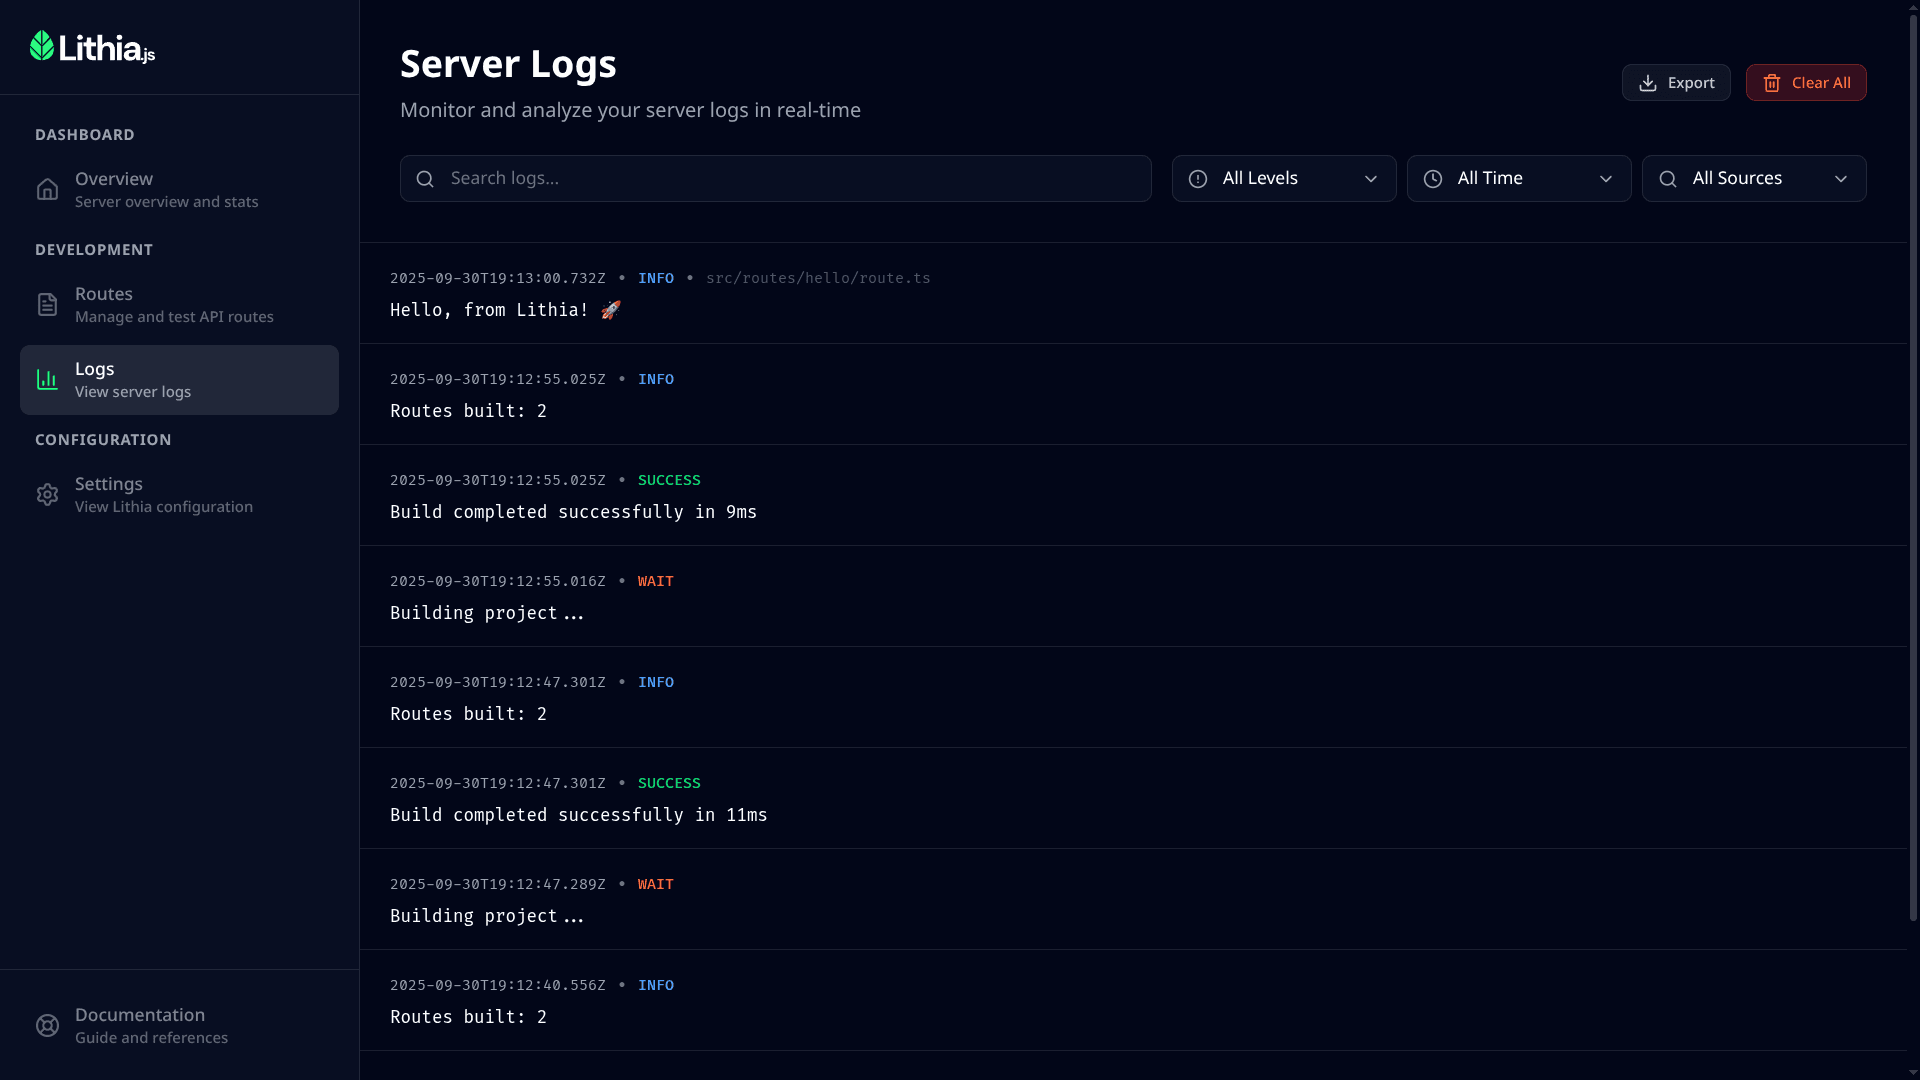
Real-time log streaming with advanced filtering and syntax highlighting. Search through logs, export data, and debug issues without ever leaving your browser or opening terminal tabs.
See logs as they happen
Info, warn, error filtering
Find and save log data
Easy to read log formatting
Inspect all your server settings and active configuration in real-time. The brain of your Lithia application, made visible.
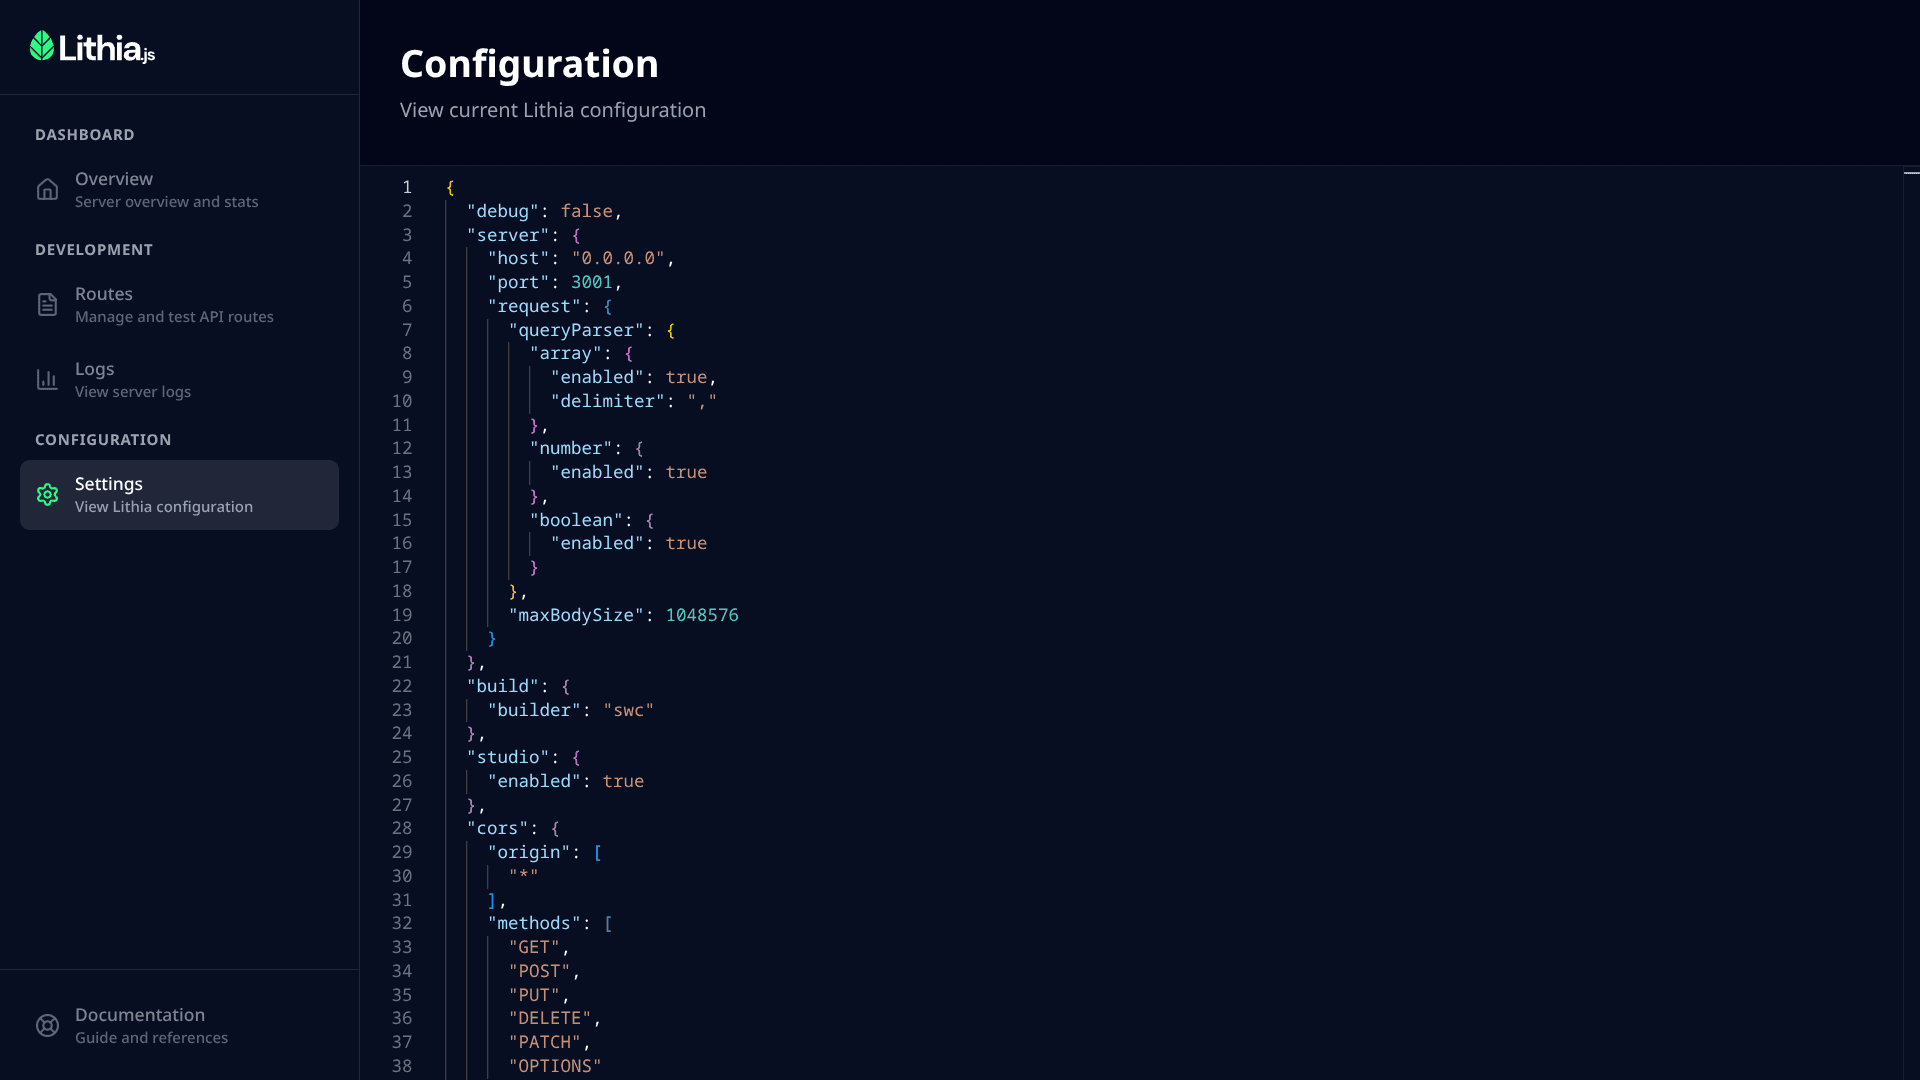
Complete overview of your lithia.config.ts file with live updates. See all active settings, middleware, plugins, and configurations without having to open files or restart your server.
Complete lithia.config.ts view
Changes reflect instantly
View config without opening files
Easy to understand settings